
The data describe scheme assets and payments. They do not show whether an individual pension is performing well or whether a defined-benefit scheme has enough assets to meet all its promises.
What the ONS found
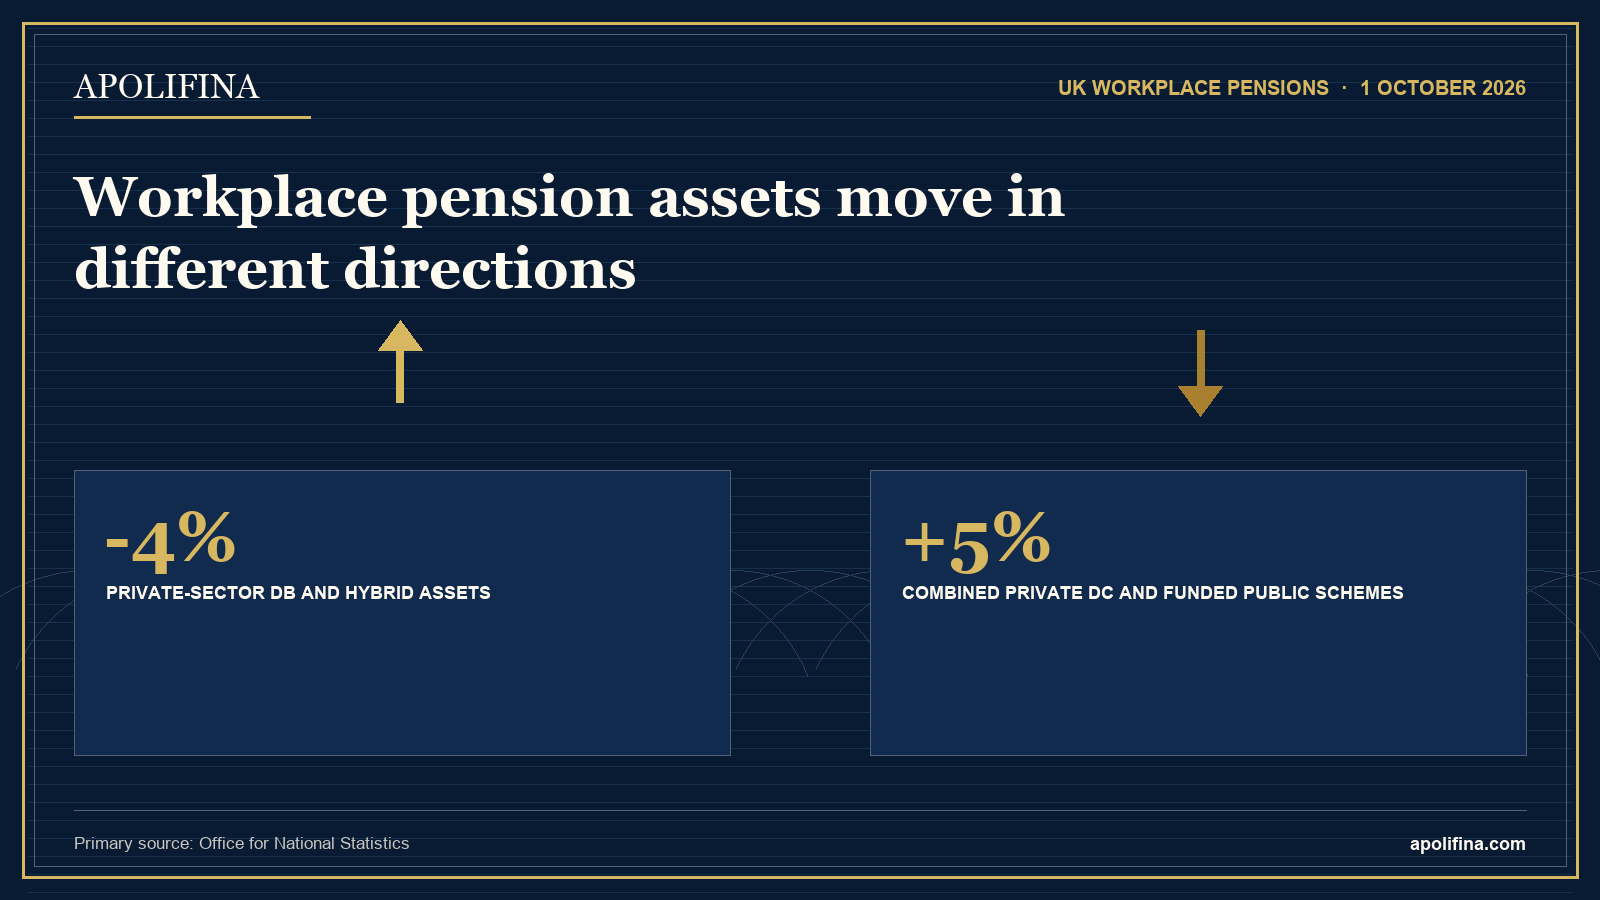
The market value of private-sector defined-benefit and hybrid pension schemes fell from £1.137 trillion on 30 September 2025 to £1.091 trillion on 31 March 2026. That was a reduction of £46 billion, or 4%.
Over the same period, the combined market value of private-sector defined-contribution schemes and public-sector funded defined-benefit and hybrid schemes increased by £50 billion, or 5%, from £1.001 trillion to £1.051 trillion.
The categories are combined in the published headline, so the 5% increase should not be interpreted as the performance of a typical person's defined-contribution pension.
Why the two groups moved differently
The ONS said the decline in private-sector defined-benefit and hybrid assets was mainly caused by lower asset values, with a smaller contribution from higher non-pension liabilities.
For private-sector defined-contribution and public-sector funded schemes, the increase principally reflected higher direct-investment values. Public-sector pooled investment vehicles also increased.
Private-sector defined-contribution scheme assets rose by £16 billion, or 4%, while public-sector funded defined-benefit and hybrid assets increased by £35 billion, or 6%.
The value of equities held directly by these schemes increased through a combination of purchases and market movements.
A fall in assets is not automatically a funding crisis
Asset values alone cannot establish the financial health of a defined-benefit pension scheme.
A full funding assessment must also consider the present value of pension promises. That liability can move when interest rates, inflation expectations, longevity assumptions and other actuarial inputs change.
The ONS figures exclude pension-entitlement liabilities from the market-value measure. It would therefore be misleading to conclude from the 4% asset decline alone that private-sector schemes became 4% less well funded.
Insurance-policy holdings declined
Private-sector defined-benefit and hybrid schemes' holdings of insurance policies fell from a peak of £190 billion to £178 billion between September 2025 and March 2026.
Insurance policies can be used in pension risk-transfer arrangements, including buy-ins. In a buy-in, the scheme purchases an insurance policy to cover some or all member benefits but remains responsible for paying those benefits.
The change in reported holdings does not by itself reveal the volume or value of new buy-ins and buyouts across the market.
Defined-contribution lump sums remained elevated
Lump-sum benefits paid by private-sector defined-contribution schemes averaged approximately £1 billion per quarter between July 2024 and March 2026.
That compares with an average of £590 million between late 2022 and mid-2024, and £430 million between early 2021 and September 2022.
The figures cover lump-sum benefits, including death benefits. They do not establish why payments increased or how much was withdrawn by people making retirement decisions.
What this means for investors
The data illustrate how different pension structures respond differently to market movements, contributions, benefits and asset-allocation decisions.
For members of defined-contribution schemes, personal outcomes depend on their own contribution history, fund choices, charges and investment performance. Aggregate industry asset growth is not a substitute for checking an individual statement.
For defined-benefit members, the employer and scheme's funding position matter more than the headline movement in total industry assets.
The figures may also interest insurers, asset managers and pension-administration businesses, but the release does not identify individual commercial beneficiaries.
The Apolifina view
The most important lesson is not that one type of pension performed better than another.
These are large aggregate values covering structurally different schemes. They are useful for understanding the direction of the pension system, but they cannot answer whether a particular member is on course for retirement or whether an individual scheme is fully funded.
Investors and pension members should resist converting a movement in total assets into a conclusion about personal returns.
What remains uncertain
The ONS introduced an updated survey sample for data collected from the third quarter of 2025. It warns that estimates in upcoming quarters may therefore be subject to greater revision.
The figures run only to 31 March 2026 and do not capture more recent market movements. The next release is scheduled for 8 April 2027.
Primary source and verification
The asset, insurance-policy and lump-sum figures, coverage limitations, survey change and next release date were checked against the ONS bulletin released on 1 October 2026.
Continue reading: Workplace pensions and SIPPs explained · Standard Life operating profit rises 25% · How to choose an investment platform