
What the ONS reported
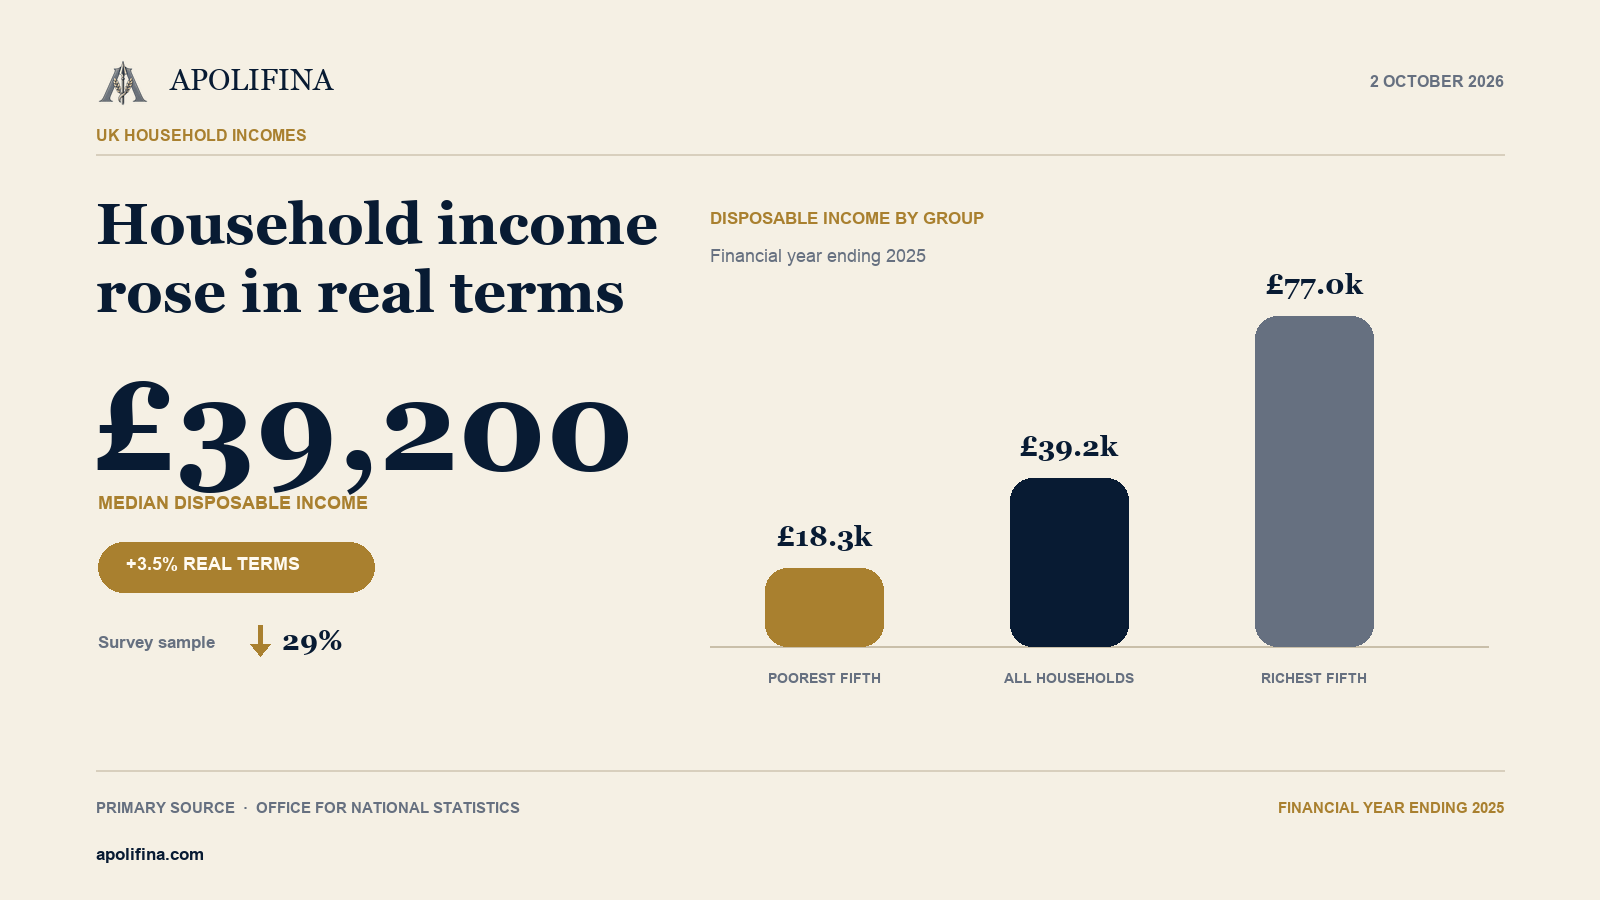
Median household disposable income in the UK was £39,200 in the financial year ending March 2025. After adjusting for inflation and household composition, that was 3.5% higher than in the previous financial year.
Disposable income is the amount households have available for spending and saving after direct taxes including Income Tax, National Insurance and Council Tax. It includes employment income, private pensions, investment income and cash benefits.
Income increased across the distribution
The median disposable income of the poorest fifth of the population increased by 5.6% to £18,300. The ONS said this brought the measure back into line with its pre-pandemic level in the financial year ending 2020.
For the richest fifth, median disposable income increased by 5.0% to £77,000, returning to its financial year ending 2021 level after two years of decline.
Income inequality was broadly stable. The Gini coefficient decreased by 0.2 percentage points to 32.7%, while mean disposable income for the richest fifth remained 5.6 times that of the poorest fifth.
Why the figures require caution
The achieved sample fell from about 11,300 households to 8,000, a reduction of 29%, after the Survey of Living Conditions was discontinued partway through the collection period.
The ONS describes the financial year ending 2025 as a transitional year. It warns that smaller samples, non-response bias and changes in the composition of participating households increase uncertainty, particularly for detailed income groups and retired households.
The estimates also exclude people living in institutional settings and those experiencing homelessness. Household surveys can under-report income at both the top and bottom of the distribution.
What this means for investors
Higher real disposable income can support household spending and saving, but these figures cover the year to March 2025 and should not be treated as a live reading of consumer conditions in October 2026.
The national median also does not describe every household. Mortgage costs, rent, energy use, taxes, family composition and employment circumstances can produce very different outcomes.
For consumer-facing companies, the release offers evidence that real household resources improved during the measured period. It does not establish how much of that improvement was spent, saved or absorbed by later price increases.
The Apolifina view
The headline improvement is meaningful, but the quality warning matters just as much as the 3.5% increase.
The broad direction is consistent with improving real household income, while detailed claims about individual groups require more caution. Investors should use the release alongside current wage, inflation, retail-sales and savings data rather than treating it as a standalone consumer signal.
What remains uncertain
The figures are survey estimates and may be revised. The reduced sample and compositional change make some year-on-year movements harder to distinguish from sampling variation.
The release also predates more recent changes in inflation, interest rates and household costs. It therefore provides an important historical benchmark, not a complete picture of present living standards.
Primary sources and verification
- ONS: Average household income, UK, financial year ending 2025
- ONS household disposable income dataset
The income, distribution, inequality and sample-size figures were checked against the ONS bulletin released on 2 October 2026.
Continue reading: UK inflation rises to 3.1% · UK retail sales rise 0.5% · UK inflation and interest rates